
The takeaway: Protect yourself from sequence of returns risk so it doesn’t wreak havoc with your retirement plans. Sequence of returns risk is the danger that market returns will decimate your nest-egg, just as you finally need that money to live on. If you plan to ever live off your savings, you’ll want to understand sequence of returns risk so your money lasts as long as you do.
$$$
“I enjoy your blog, but I don’t know why you’d encourage people to buy bonds. Historically, bonds barely pay half of what stocks pay.” So said a friend the other day over Zoom.
Boomer, on the one hand she’s right. Stocks do pay better than bonds; averaging 11.57% vs. 5.15%, respectively, since 1928.1 But without at least some bonds, your nest-egg is subject to the dangers of sequence of returns risk. Understanding sequence of returns risk is vital for anyone ever planning to retire and live off their nest-egg.
What’s sequence of returns risk?

She was fine until I told her about the $1 million nest-egg cut in half in only three years. I was trying to protect her against sequence of returns risk!!
Sequence of returns risk happens when market losses occur at the beginning of your retirement. It’s when the market annually posts a series of negative returns shortly before or shortly after you retire.
Sequence of returns risk reared its ugly head when the dot.com bubble burst in 2000, and on its heels came September 11th.
Today, conditions are ripe for it to happen again with the pandemic.
Tomorrow, it’ll be some other situation.
Regardless of circumstance, understanding this risk can help you manage your nest-egg to avoid the huge losses sequence of returns risk can bring.
If you want your money to last as long as you do, consider this post required reading.”

She’s so bossy about required reading. Let’s get some social distance.
Forewarned is forearmed.
How sequence of returns risk unfolded in real life.
Using actual stock market returns, here’s what happened to real people who retired in the year 2000 with a $1 million nest-egg. (Add or subtract as many zeros as apply to you.)
I don’t know how much these folks withdrew from their nest-egg, but let’s assume it was $50,000 annually, adjusted each year for inflation.2
Table 1 shows what happened to these people. Here’s the shocker: their $1 million nest-egg was nearly cut in half in three short years. It was pretty well gone in 17 years.
Table 1. When sequence of returns risk results in market losses coming at the beginning of your retirement, its easy to blow through your nest egg.

Note: The formula to achieve year-end stock values = preceding year’s value x (1 + current year market return). Example: for the year 2000, the stock value is $1,000,000 x (1+(-.0903) = $909,700 . For 2001, the ending stock value is $909,700 x (1+(-.1185) = $757,826. The same method is used for calculating annual withdrawals: $50,000 x (1+(.0280)=$51,400.
Source: Stock returns are from the Federal Reserve database in St. Louis and compiled by my former UCLA finance instructor–Aswath Damodaran–currently at the NYU Stern School of Business. Inflation rates can be found here. (Scroll down.)
Boomer, let.that.sink.in.
A $1 million nest-egg was cut in half in three years.
(I need air.)
That, my shell-shocked Boomer, is (preventable) sequence of returns risk. It’s most lethal when it happens at the beginning of your retirement.

I need a moment to let this all sink in.
Losses from sequence of returns risk aren’t nearly as harmful when they come toward the end of your retirement.
When negative market returns occur late in your retirement, sequence of returns risk isn’t nearly as devastating. For example, in Table 2 we reverse the order of the market returns used in Table 1. (See second column in both tables.) .
When we reverse the order, and losses come late in retirement, the effects aren’t nearly as harmful. As shown in Table 2, the portfolio finishes with a balance of $1.4 million.
In contrast, the early losses we saw in Table 1 left a portfolio with only $21,461.
Table 2. When losses from sequence of returns come at the end of your retirement, the harm isn’t nearly as devastating.
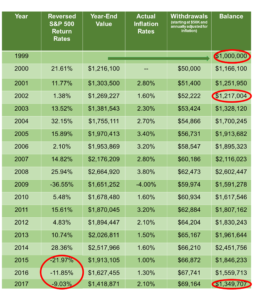
Note: The formula to achieve year-end stock values = preceding year’s value x (1 + current year-end stock values). Examples shown in the note under Table 1.
Source: Stock returns are from the Federal Reserve database in St. Louis and compiled by my former UCLA finance instructor–Aswath Damodaran–currently at the NYU Stern School of Business. Inflation rates can be found here. (Scroll down.)

Hey! You in the front row looking out the window. Listen up! Ya gotta understand sequence of return risk to prevent it.
The only difference was that the first portfolio, in Table 1, suffered major losses because sequence of return risk occurred at the beginning retirement.
The other portfolio, in Table 2, had the same negative returns, but they came at the end of retirement.
The results were stark: $21,461 vs. $1,349,707.”
Boomer, it’s all about when negative returns occur. See the summary in Table 3.
Table 3. Recap: the astonishing difference when negative
returns happen at the beginning vs. the end of retirement.

Source: BoomerMoneyandMore.com data calculations using sources cited for Tables 1 and 2.
Why is sequence of returns risk so damaging when losses come early in your retirement?

I could’ve left this stinkin’ job years ago if I’d understood sequence of return risk.
When the market goes down early in your retirement, it reduces the price of stock shares. As such, stocks are selling cheap. To sell off those cheap shares for living expenses, you have to sell more of them to get the money you need.
You then have fewer stocks remaining that can grow and appreciate. Consequently, your nest-egg depletes more quickly than it would if you could’ve sold-off fewer shares at a higher price.
Capeesh?
(If no, head down to footnote 3.)
The fix: diversification.
If you have money coming in and can make deposits to your nest-egg, consider diversifying your portfolio. Diversification is when different assets, like stocks vs. bonds, respond differently to the same event; one goes up and the other goes down.4
Notice the circled entries in columns D and F in Table 4 below. When stocks go down, bonds go up. This is diversification in the wild, with actual market returns.
Table 4. With diversification, the portfolio finishes $1.2 million (not $21K); sequence of return risk is avoided; and as stocks go down, bonds go up–and vice versa. What’s not to love?
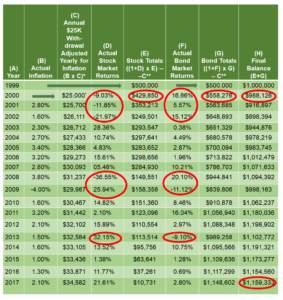
Note: *The formula for withdrawal rates, column C, is the preceding year’s withdrawal x (1+ current year’s inflation rate).
**The formula to achieve year-end stock and bond values, columns E and G, = preceding year’s value x (1 + current year market return).
Examples for all of the above are given in Table 1 footnotes.
Source: Stock and bond returns are from the Federal Reserve database in St. Louis and compiled by my former UCLA finance instructor–Aswath Damodaran–currently at the NYU Stern School of Business. Inflation rates can be found here. (Scroll down.)
Also in Table 4, $50,000, adjusted for annually for inflation, is taken out each year — $25,000 from stocks and $25,000 from bonds.
Compare the results: the diversified portfolio, in Table 4 above, closes out at $1.2 million and sequence of return risk is avoided. In contrast, those poor folks in Table 1 only ended up with $21,461.
This, ladies and gentlemen, was the exact example I wanted to tell my friend who thinks bonds are ridiculous. ?
I wanted to tell her they’re ridiculous the same way home and car insurance are ridiculous. That insurance may be costing her money, but go without it, and it could be costing her a lot more further down the line.

Hang up! We need to talk about diversification’s effect on sequence of returns risk.
(More on diversification can be found in the asset allocation series in general–right side bar–and specifically here and here.)
Up next.
In an upcoming post, we’ll discuss some other methods of protecting your nest-egg. For now, you clearly know more about sequence of returns risk than most civilian investors out there. You also know how to lessen its effects through diversification. Nicely done, Boomer.
Until next month, be safe. Stay well.
You got this.
$$$
P.S. Always do your own due diligence.
Footnotes.
1Stock returns are from the Federal Reserve database in St. Louis and compiled by my former UCLA finance instructor–Aswath Damodaran–currently at the NYU Stern School of Business.
2This post describes how to adjust your withdrawals for inflation each year and provides a step-by-step guide on how to draw down your nest-egg and determine how big a nest-egg you’ll need for the income you require.
3Here’s how to think about it. Suppose you need $1000 a month to supplement your social security. In a down market, stocks might on average be selling for $20 a share. You need to sell off 50 shares to get your $1000. ($20 a share x 50 shares = $1000).
In contrast, in an up market, stocks might be averaging $50 a share. You only need to sell 20 of them to get your $1000. ($50 a share x 20 shares = $1000).
Since you didn’t have to sell off as many shares in an up market, as you did in a down market, you now have more shares left that can grow and appreciate in value.
How much more? 150% more! (50 shares sold in the down market – 20 shares sold in the up market) / 20 sold in the upmarket shares = 150% more shares had to be sold in the down market).
And this is just monthly. Get three years with differences like these and it’s all over but the shoutin’.
4Tip to the hat to Nick Lioudis over at Investopedia for this plainspoken definition of diversification. Tip of the hat also to Boomer.Money and to Investopedia for their descriptions of sequence of returns risk.
5As always, when I’m talking about stocks, I’m referring to stock mutual funds; preferably index funds.
$$$