

The takeaway: The perfect setup for outliving your money is not knowing where it goes. This post helps you figure out where the money went and provides a juicy look at what others your age are earning and spending. Don’t outlive your money!
$$$
Part 3 in the Don’t Outlive Your Money Series. (Updated 1/18/23)
$$$
Happy New Year, y’all! In an earlier post, I described how I was at a family lunch on the craggy coast of Maine. Out of the blue, cousin Vinny (or was it sister Golden Hair?), blurts out: “I just want my financial planner to tell me if I can retire.” When someone says something like this, they’re basically saying they’re not sure their money will last as long as they do.
To not outlive your money, ask yourself these three questions

Announcing three questions you need to ask to not outlive your money!
(Cue trumpets)
- Based on my health and family history, how long do I suspect I’ll need the money to last?
- What are my essential and non-essential expenses, and what ones will carry over into retirement?
- How big must my nest-egg be to generate the income I require to cover my retirement espenses?
We’ve already answered question #1 and question #3. Today we cover question #2: how much we need to cover our essential vs. non-essential expenses. Knowing the difference can keep us from living in our kids’ basement.
But here’s the thing…
Some of you reckless reprobates don’t know how much retirement income you’ll need because you don’t know where all that hard-earned money is going. (I know these things.) 😲 And why don’t you know where the money goes? Because, gentle Boomer, you don’t track your expenses.
And, as day follows night, when we don’t track expenses, we don’t know:
- how much money is slipping through our fingers each month;
- how much money from our our current expenses will carry over into our retirement; and
- how likely we’ll be to stab ourselves with a ballpoint pen as we read one more sermonette on tracking expenses.
Worse, the retirement replacement ratio, described in scintillating detail here, won’t help you. It comes too late in the game for bodacious Boomers like us, according to research by the U.S. Government Accountability Office.
When you don’t track expenses, what you’re left with is asking friends, family, and financial advisors if they think you can retire. It’s the perfect set-up to outlive your money. None of these folks truly know you the way you know yourself.

But behold: I bring tidings of comfort and joy
Although you may not know where the money goes, Uncle Sam does. Each year he instructs the Department of Labor to conduct an extensive Consumer Expenditure Survey. The survey is like the U.S. Census Survey, except it annually asks American households:
- how much the household earns;
- how much it spends; and
- exactly what it spends its money on.
You can use these data to approximate where your own money goes. You may spend more, you may spend less. But odds are, relative to your total income, your spending is proportionally similar to others your age in the survey.
Since half the readers of this blog suffer the heartache of being too young to be Boomers, data for those 45 to 54-years old are included to aid their planning and ease their misfortune. “
The data are reported in terms of household. Household size varies by age, but roughly comprises two people, as you can see from Table 1 below.
Table 1. Boomer households are roughly 2 people

U.S. Department of Labor Consumer Expenditure Survey, 2021 (Table 1300). Data published September 8, 2022 by the Bureau of Labor Statistics.
Annual household income and expenses
Below, Table 2 shows household income and expenses by age group. Since half the readers of this blog suffer the heartache of being too young to be Boomers, (site stats tell me these things), data for those 45- to 54-years old are included below to aide their planning and ease their misfortune. Although not Boomers, data for those age 75+ is included so that you, awesome Boomer, can financially plan for your own golden years.
Table 2. Average annual household income and expenses by age group.

U.S. Department of Labor Consumer Expenditure Survey, 2021 (Table 1300). Data published September 8, 2022 by the Bureau of Labor Statistics.
How do you compare?
As you can see, the older you are the less income and expenses you have. For you lovable visual learners, Figure 1 shows a visual representation of the table above.
Figure 1. At a glance – Average annual household income and expenses by age group.

U.S. Department of Labor Consumer Expenditure Survey, 2021 (Table 1300). Data published September 8, 2022 by the Bureau of Labor Statistics.
Worst of all, those age 75+ are spending 6% a year more than their after-tax income is bringing in….If we plan to be self-supporting after age 75, these data show a mid-course correction may be in order. “
Here’s what to notice about annual after-tax income vs. expenses
Looking at the percent difference between folks’ annual after-tax income and their annual expenses in Table 2, above, we can see the following sober news.
- Households between ages 55 and 64 have, on average, an 18% cushion between their annual after-tax income and their annual expenses… (so far so good)…;
- But those age 65 to 74 have, on average, only a 6% cushion between their annual after-tax income and their annual expenses;
- Worst of all, households age 75+ are spending 6% a year more than their annual after-tax income is bringing in.

My adult children will support me if I outlive my money. Sadly, everyone (but me) will suffer. (Don’t be this woman!! 😡 )
Given that those age 75+ will likely live another 10 years, that’s a long time for their expenses to exceed their income. Think about the impact such deficit spending will have, not just on them, but on their adult children who need to fund both their own retirement and their kids’ education.
If we plan to be self-supporting after age 75, and not wreck the golden years of our kids–and the educational opportunities of our grandchildren–these data suggest a mid-course correction long before we hit 75 is in order. No?
But enough of this buzz kill! Back to tidings of comfort and joy.
Since we now know the juicy data on how much households are earning, let’s check out where they’re spending all that dough. Table 3 shows average major household expenses. Let these expenses jog your own memory for where your money may well be going.
You can find out what various forms of spending comprise each category by clicking on the links in the Appendix at the end of the post. For example, for better or worse, Uncle Sam classifies pets as a subcategory of entertainment. Who knew?
Table 3. Major annual household expenses by age group

Note: Cash contributions include: alimony and child support payments; care of students away from home; and contributions to religious, educational, charitable, or political organizations.
Source: U.S. Department of Labor Consumer Expenditure Survey, 2021 (Table 1300). Data published September 8, 2022 by the Bureau of Labor Statistics.
Here’s what the data look like for you overachieving visual learners.
Fig. 2. At a glance – Major annual household expenses by age group

Source: U.S. Department of Labor Consumer Expenditure Survey, 2021 (Table 1300). Data published September 8, 2022 by the Bureau of Labor Statistics.
With the exception of health care and “cash contributions,” which include alimony and donations to charities and political organizations, most annual expenditures decline with age. But our need for health care increases, as does the price of health services, leading us headlong into that path of 6% deficit spending after age 75 we discussed earlier.

Before I run these labs, I’ll need a $2.5 million deposit.
Could a course correction be called for long before 75? Did the Beatles redefine “rock concert” when they played Shea Stadium? Hint: Yes.
But back to what others your age are spending…
Minor annual household expenses.
Here are other self-care, pleasures, and vices we Boomers are spending money on. How do you compare?
Table 4. Annual “minor” household expenses.
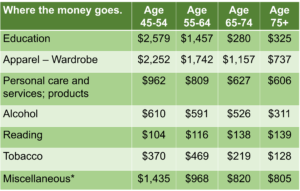
Note: Definition of “miscellaneous.” As defined in Table A in the appendix below, miscellaneous includes safety deposit box rental, checking account fees and other bank service charges, credit card memberships, legal fees, accounting fees, funerals, cemetery lots, union dues, occupational expenses, expenses for other properties, and finance charges other than those for mortgages and vehicles.
Source: U.S. Department of Labor Consumer Expenditure Survey, 2021 (Table 1300). Data published September 8, 2022 by the Bureau of Labor Statistics.
Here’s how these data look visually. Once again, we see that most annual expenses decline with age.
Figure 3. At a glance – “minor” annual household expenses

Note: Definition of “miscellaneous.” As defined in Table A in the appendix below, miscellaneous includes safety deposit box rental, checking account fees and other bank service charges, credit card memberships, legal fees, accounting fees, funerals, cemetery lots, union dues, occupational expenses, expenses for other properties, and finance charges other than those for mortgages and vehicles.
Source: U.S. Department of Labor Consumer Expenditure Survey, 2021 (Table 1300). Data published September 8, 2022 by the Bureau of Labor Statistics.
Bon voyage, Boomer!
According to AARP’s 2022 Annual Travel Report, Boomer households are expected to spend between $8,369 and $11,500 on travel in 2022. We’ll find out in their 2023 report how close Boomers came. In the meantime, how does this compare to your travel expenses?
(Uncle Sam doesn’t break travel down into a discreet category, which is why the AARP figures are used here.)
Final things to consider as you look at these Boomer expenses.

Crystal ball: Tell me if I’ll outlive my money and where the heck it all goes!
This is how most people your age are spending their money. Although you may spend more or less, proportionally, your expenses are likely to be quite similar.
Ask yourself:
- Compared to others’ household income (Table 1) am I proportionally spending less or more than households in my own age group? (Table 2)
- How much do I think I’m spending on the items in Tables 2 and 3?
- If I’m working now, what do I think these expenses will be when I retire? Which will I eliminate?
Next up: the nest-egg

Next up: how big your nest-egg needs to be to generate the retirement income you need!!
Boomer, if the expenses we’ve seen above will carry over into your retirement, then you’ll want to know how much you’ll need to cover these expenses.
Until then, why not peek at your statements and try to do a precise accounting of where the money goes? The more accurate your assessment, the easier it will be to determine how much you’ll need for retirement.
Don’t outlive your money.
$$$
Appendix: Expenses comprising each category.
In the table below, click on each link to see what the U.S. Consumer Expenditure Survey includes in each expense category.
Table A. Links for expenses comprising each category of the Consumer Expenditure Survey.
Source: Consumer Expenditure Survey Glossary which describes the expenses comprising each category.
$$$