

The takeaway: Would you buy a product without knowing your odds of needing it? Your odds of needing long-term care are based on specific factors, all of which are outlined in this post. And the news is better than you might expect. So when that sales agent calls, don’t be too quick to whip out your checkbook.
$$$
The morning before the 2022 Kentucky Derby, first alternate Sonny Leon learned that he and horse Rich Strike, would be allowed to enter the race. Another trainer had chosen to withdraw his horse. Odds of Rich Strike winning the race were dismal, at best. But 24 hours later, the world would be reminded that miracles still happen.

He pulled ahead and kept running right to victory.
With his horse ranked last to win, Sonny Leon and his charge started in the back of the field and patiently began passing horse after horse, making their way forward. They were briefly stuck in the middle of the pack, until a small gap opened between two horses running neck and neck. Leon blasted Rich Strike through the gap, maneuvered him to the inside rail, and then, in a final burst of energy, blitzed across the finish line for a decisive win.
In the 148-year history of the Kentucky Derby, and not since 1913, had such a massive upset occurred.
And it all happened with 80 to 1 odds
(Cue Disney studios.)
A horse is a horse, of course…

What d’ya mean there was no Plan B for long-term care?
The owner and trainer stared down Rich Strike’s odds of winning and losing. They plotted what actions they would take in either case. In other words, they planned for the desired outcome, but prepared for Plan B.
There are a lot of Plan B’s in this world, of which long-term care is only one. To know if that’s the Plan B we should prepare for, it helps to know our odds of ever needing it.
Be brave. Buckle up. It’s time stare down our own long-term care odds by getting answers to the questions below.
If I were to need it, what’s the price tag for long-term care?
Table 1 shows the current cost of long-term care nationwide. (Click here for your state’s cost of care.) Looking at these costs makes clear why you might want to know your odds of ever having to pay these wretched expenses.
Table 1. The 2022 Median National Price Tag for Yearly Long-Term Care
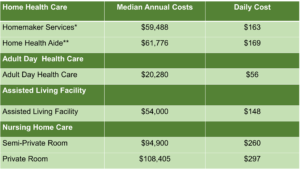
*Based on 5 days per week 52 weeks.
**Based on 44 hours per week 52 weeks.
Source: Cost of Care [Nationwide] Survey, 2022 by Genworth Financial, Inc., January 2022.

What are my odds of needing long-term care?
A 2021 report from U.S. Health and Human Services (HHS) projects that 47% of folks turning 65 between 2020 and 2024 will eventually require paid long-term care. Figure 1 shows that women lead the pack, with 53% expected to need long-term care. Men are a distant second, at 41%.
But…. when we dig a little deeper, we see farther down this page that these results are actually more hopeful than they appear above.
Figure 1. 47% of Americans are projected to need long-term, with women outpacing men.

Source: ” Long-Term Services and Supports for Older Americans: Risks and Financing, 2020.” ASPE Research Brief, HHS Office of the Assistant Secretary Planning and Evaluation of Behavioral Health, Disability, and Aging, January 2021.
(A word to you annoying awesome overachievers.)
If you ever experienced the pain, heartache, and urge to stab yourself with your #2 pencil while sitting through a statistics class, you understand there’s a difference between the “probability” of an event and the “odds” of an event. “Probability” is a proportion, often multiplied by 100 to create a percentage. “Odds” refers to a ratio of how likely an event is to occur. For purposes of this post, the two are used interchangeably. Apologies to you pain-in-the-patoot lovable purists…

I’m this close to stabbing myself with my #2 pencil.
If I’m turning 65 between now and 2024, what are my odds for length of stay in paid long-term care?
Overall, U.S. Health and Human Services projects that 77% of men and 68% of women will either never need paid long-term care, or, if they do, will need it for less than one year. See Table 2.
Table 2. Overall, 77% of men and 68% of women will either never need paid long-term care, or will need it for less than one year.

Source: “Long-Term Services and Supports for Older Americans: Risks and Financing, 2020.” ASPE Research Brief, HHS Office of the Assistant Secretary Planning and Evaluation of Behavioral Health, Disability, and Aging, January 2021.
![]()
In sharp contrast to the table above, insurance companies, outdated government websites, and others who stand to financially benefit commonly report that 70% of folks will eventually need long-term care.
Be wise, Grasshopper.
The government’s own Health and Human Services research group–the group that actually measures these things–shows that the 70% number for paid long-term care is false. (See Tables 1 and 2.)
Based on my current age, what are my odds of needing long-term care in the next five years?
Figure 2 below shows that it’s not until you reach your nineties that you’ll have more than 50/50 odds of needing long-term care. If you’re a healthy 65-year-old female and reach age 70, you’ll have only a 6% probability of needing long-term care. However at 90, those odds go up to 58%. Results are similar for men.
No surprise, the longer we live the more likely we are to need care, with we women leading the charge across all age groups.
Figure 2. If you’re healthy at 65, it won’t be until you reach your nineties that you’ll have more than 50/50 odds of needing long-term care. 
Sources: Long-Term Care and Financial Planning, Health View Services, June 2021; Long-Term Insurance Facts – Data – Statistics – 2022 Reports, American Association for Long-Term Care Insurance, 2022, www.aaltci.org.
How does having a specific disease affect my odds of needing long-term care?
I’d rather you hear this from me than a stranger, friend: chronic diseases definitely affect your odds of needing long-term care, particularly if you’re female. Worse, the CDC reports that 60% of adult Americans have a chronic diseases, such as diabetes or cardiovascular disease. Further, 40% percent have multiple chronic conditions.
Table 3 below shows how these diseases affect the likelihood you’ll require long-term care.
Table 3. Selected diseases increase your odds of needing long-term care, particularly if you’re female.

Source: “Long-Term Care and Financial Planning,” Health View Services, June 2021. (Requires download to see the report.)
If I’m part of that 47% that lands in long-term care, what are the odds for how long I’ll be there?
If your parents or grandparents needed long-term care, you’re likely unimpressed with Table 2’s rosy odds showing that, overall, 77% of men and 68% of women will either never need long-term care, or will need it for less than one year. You’re right to be unimpressed.
Figure 3 below shows if you’re in that unlucky group who will require long-tem care, 40% of you women and 44% of you men will need care for less than one year.
And that’s the good news.
The “bad news” is that roughly 60% of those in the unlucky group will require care for more than one year.
Figure 3. Of only the group that will need long-term care, roughly 60% will need it for more than one year.

Source: ” Long-Term Services and Supports for Older Americans: Risks and Financing, 2020.” ASPE Research Brief, HHS Office of the Assistant Secretary Planning and Evaluation of Behavioral Health, Disability, and Aging, January 2021 and author calculations based on U.S. HHS data.
 Enough about odds already! If I end up in the 47% that needs long-term care, how many years will I be there and how much will I pay?
The last column in Table 4 shows that if you’re in the unlucky group who’ll need long-term care, on average you’ll need care somewhere between 2.4 and 3.2 years. You’ll pay somewhere between $172,000 and $235,000. If you’re female, or you suffer cognitive impairment, your average length of care will last longer, and be more expensive.
Table 4. Average costs and years of care for only that group requiring long-term care.

Sources: Please see appendix one for data sources.
Keeping your odds in perspective.

Apparently he did need a weatherman to know which way the wind blows.
The data show that 68% of women and 77% of men either won’t need paid long-term care, or will “only” need it for less than a year.
Despite this relatively good news, and even though you, personally, don’t need a weatherman to know which way the wind blows, did you see those storm clouds brewing on that sunny horizon? They suggest that a number of unlucky folks will still require long-term care–particularly if they are:
- female;
- older;
- in poor cognitive health; or
- suffering specific chronic conditions.
Those are the odds. Odds are not destiny.
Even though you’re not a horse, (of course)….
Sometimes a horse with the worst odds of winning, blasts through to the winner’s circle. That may well be the case with us. But it never hurts to prepare for Plan B (just in case); and Plan B is either buying long-term care insurance, self-funding your own long-term care, or simply forgetting the whole darn thing, which means Medicaid.
We’ll talk all about it all in the next couple of posts. Add your own due diligence to this equation, and when we’re done, you’ll be among that rare group of folks making their own long-term care decisions–immune to the influence of those seeking to profit off your decision.
You got this.
$$$
Appendix 1.
A. Sources for Table 4. (1) “Formal Cost of Long-Term Care Services,” PWC, 2017. These data are based on a sample of over 200,000 long-term care recipients whose insurance claims were supplied by eight of the nation’s largest long-term care companies. Cost of care figures have been adjusted for long-term care industry inflation to reflect 2022 costs. (2) ” Long-Term Services and Supports for Older Americans: Risks and Financing, 2020.” ASPE Research Brief, HHS Office of the Assistant Secretary Planning and Evaluation of Behavioral Health, Disability, and Aging, January 2021. These data are based on statistical modeling techniques developed by the Urban Institute that rely on demographic data from the likes of Medicare, Social Security, and Labor Statisitics, as well as data from the private sector. They account for the 10,000 Boomers who turn 65 everyday, which for the four year period is about 17 million Boomers turning 65 between 2020 and 2024.
B. There are some data showing that if you’re married, a high earner, and in decent health you’ll require less long-term care than those who are unmarried, low earning, and less healthy. The data show statistically significant differences between groups, but those differences amount to about four months. Since a mere handful of months doesn’t constitute a “practical” significance, those data were not included in this post.
$$$
Long-Term Care Series (Oldest to Newest)
- Long-Term Care Insurance: Five Warnings Before You Buy
- Long-Term Care Insurance Quiz: Will I Need It? Can I Get It?
- 17 Ways to Get Turned Down for Long-Term Care Insurance. (And What Happened to Me.) ** Most popular post on blog!
- Getting Medicaid to (Maybe) Pay for Your Nursing Home Costs: The (Updated) Epic Guide!
- Three Types of Long-Term Care Insurance: You Might Not Need Any!
- Continuing Care Retirement Communities Part 1 —Seven Essential Things to Know
- Continuing Care Retirement Communities Part 2 — Four Ways to Figure Out if They’re Worth the Money
- Continuing Care Retirement Communities, Part 3 — What to Ask Before Signing on the Dotted Line.
- Staring Down Your Long-Term Care Odds–Much Better News Than You Thought.
- How to Evaluate a Long-Term Care Policy. (Hint: Know These Three Things.)
- The Three Factors Affecting Your Long-Term Care Insurance Costs
- My Encounters in the Wild With Long-Term Care Sales Agents.
$$$